1. UNDERSTANDING Risk Premia
Summary:
Global equities and bonds returned +6% and +2% per annum on average over the past 120 years.
This persistent reward, which we seek to capture with a high level of certainty, is known as Risk Premia.
S&P500 Equity Index
Reading Materials
1.0.1 Credit Suisse - GIRY 2021
> Chapters to focus on:
Introduction and historical perspective (5)
Long-term average returns (12)
Investment risk (21)
The low-return world (26)
Factor premiums (29)
2. UNDERSTANDING INDICES
Goal: How to utilise common Indices to invest in order to benefit from the persistency of Risk Premia.
Reading Materials
Overviews
2.1.1 PIMCO - Overview of Benchmarks (aka Indices)
2.1.2 S&P - Overview of an Index
2.1.3 Case study of S&P500 versus Dow Jones > Deep-dive into the iconic equity indices
Investing through an Index
2.2.1 Via Exchange Traded Funds (ETFs) > Types of indices that are accessible to retail investors (through an ETF). For a primer on ETFs, please click here instead
2.2.2 Via Derivatives / Financial Futures > Types of index that are tradable in the form of derivatives (futures). Most of the hedge funds that we invest in use futures in their portfolio. For primer on futures, please click here instead. Primer on leverage in futures can be found here.
Pitstop:
Build a simple futures portfolio on Microsoft Excel with 1 futures contract of your choice from each of these asset classes (equity index, agriculture, metals, interest rate). With US$50,000 of cash available for margin per future contract, what is your (i) market exposure and (ii) leverage for the specific asset class and overall portfolio.
Resources: https://www.cmegroup.com/markets.html
3. UNDERSTANDING OUTPERFORMANCE
Goal: To grasp the active vs. passive investing debate, and the likelihood of being able to consistently pick the best stock, strategy or asset class over time.
Reading Materials
SPIVAs
3.1.1 SPIVA Scorecard by S&P > Funds that consistently outperform benchmarks are very rare. Know the facts.
3.1.2 SPIVA Persistency Scorecard by S&P > Does past performance really matters? How long can you stay on top of the game?
Return Heat-maps
3.2.1 Blackrock - Best performing asset class (10Y Period)
3.2.2 TMOAP - Best performing asset class (35Y Period)
3.2.3 Dimensional - Best performing country for equities (20Y Period)
Nudge: I hope by now, you realise the colourful mosaic of the various heat-maps are random and difficult to predict.
Stock-picking Prowess
Abstract: We study long-run shareholder outcomes for over 64,000 global common stocks during the January 1990 to December 2020 period. We document that:
The majority, 55% of U.S. stocks and 57% of non-U.S. stocks, underperform one-month U.S. Treasury bills in terms of compound returns
2.4% of firms account for all of the US$ 75.7 trillion in net global stock market wealth creation from 1990 to December 2020.
Outside the US, 1.4% of firms account for the US$ 30.7 trillion in net wealth creation.
Question: As a stock picker, what are your chances of picking these ‘unicorns’ out of 64,000 stocks?
4. UNDERSTANDING TIMe FACTOR
For most broad based Index:
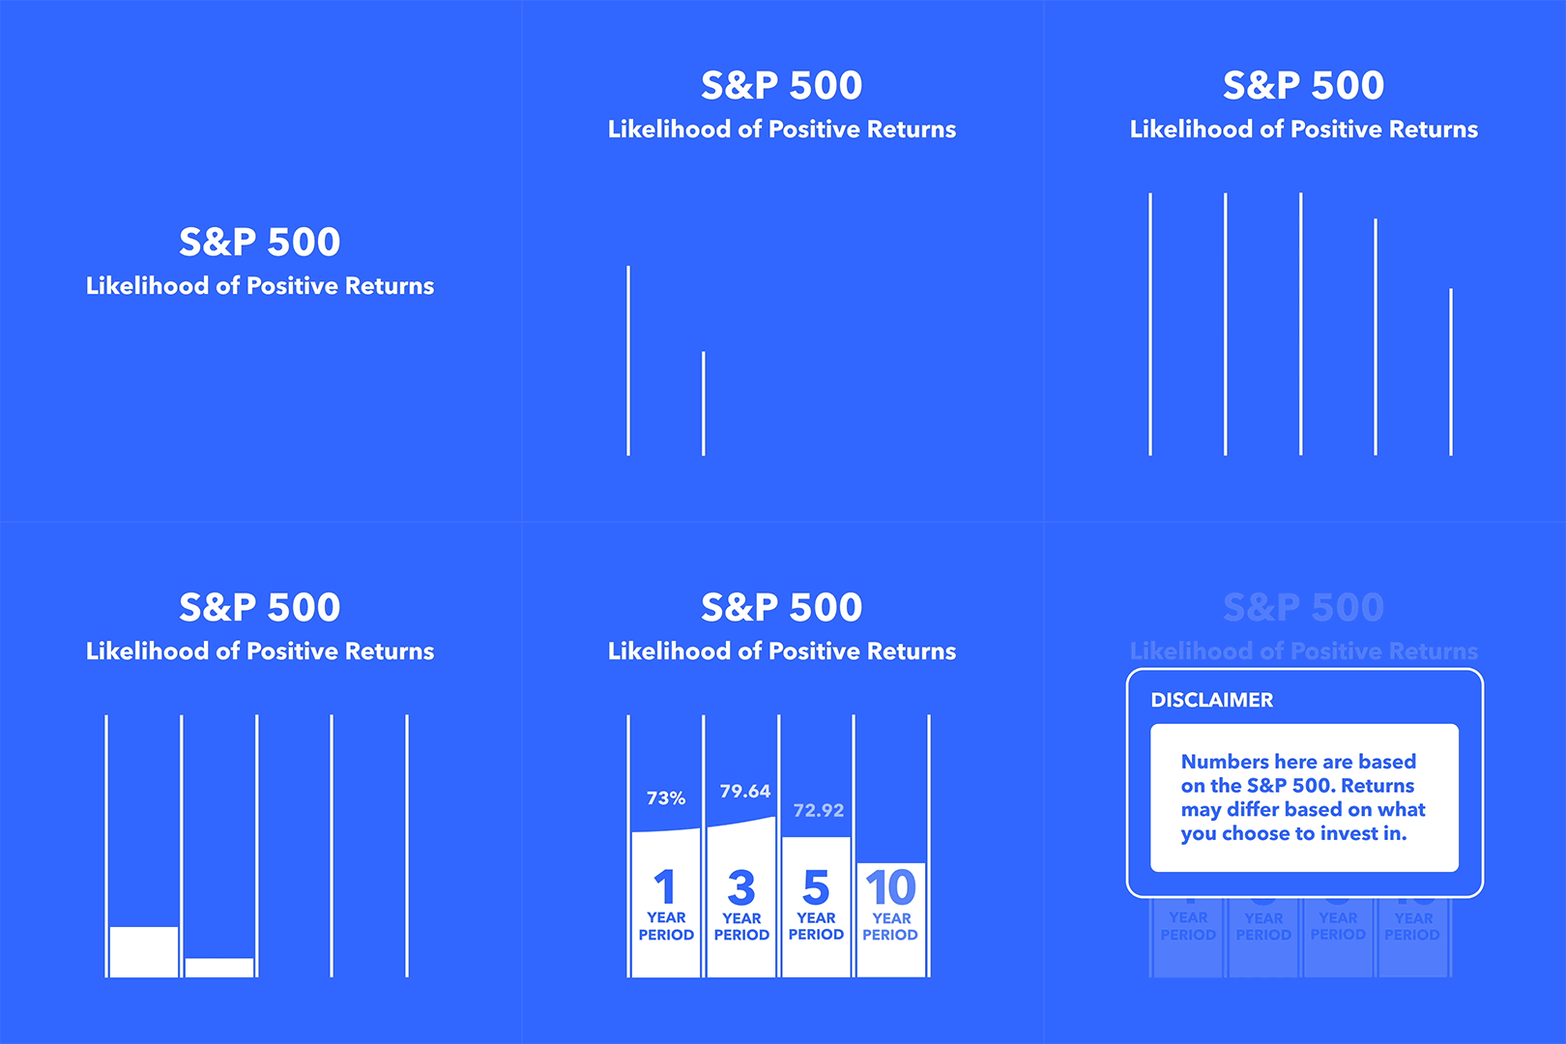
The longer holding period, the higher likelihood of a positive returns (see GIF)
The 12-Year (and above) rolling return for S&P500 is positive 100% of the time (link)
Most severe declines of 20-40 % is over in 14 months on average (Guggenheim)
Hence: We look at our investments with a minimum 10 year rolling return lens.
Sources:
http://www.lazyportfolioetf.com/allocation/us-stocks-rolling-returns/
https://www.dimensional.com/us-en/insights/the-uncommon-average
https://www.guggenheiminvestments.com/mutual-funds/resources/crucial-conversations/putting-pullbacks-in-perspective
5. UNDERSTANDING RISK PARITY
Thinking: If we cannot predict the best performing asset class or stock, can we boost pedestrian Risk Premia returns with leverage?
Reading Materials
Primers on Risk Parity (RP)
5.1.1 S&P DJI - Indexing Risk Parity Strategies
5.1.2 AQR - Understanding Risk Parity
Building RP Portfolios
5.2.1 BW - Engineering Targeted Returns & Risk
Role of Leverage
5.3.2 AQR - Dynamic Risk Management for RP
Critique & Afterthoughts
5.4.1 UBS - Fashionable but limited?
5.4.2 BW - Our thoughts about RP and All Weather (2015)
And general news about RPs underperformance


